Extended Anisotropic Diffusion Profiles in GPU for Hyperspectral Imagery
Experimental results related to the paper Extended Anisotropic Diffusion Profiles in GPU for Hyperspectral Imagery by Álvaro Acción, Francisco Argüello, and Dora B. Heras.
Abstract
Morphological profiles are common approach for extracting spatial information from hyperspectral images by extracting structural features. Additional kinds of profiles can be built based on different approaches as, for example, differential morphological profiles, or attribute profiles. Another technique used for characterizing spatial information on the images at different scales is based on computing edge-preserving filters such as anisotropic diffusion filters. Their main advantage is to preserve the distinctive morphological features of the images at a the cost of an iterative calculation. In this paper, the high computational cost associated to the construction of Anisotropic Diffusion Profiles (ADPs) is drastically reduced with the usage of GPUs. In particular, we propose a low cost computational approach for computing ADPs in Nvidia GPUs as well as a detailed characterization of the method, comparing it in terms of accuracy and structural similarity to other existing alternatives.
Downloads
Scenes
The following link contains some of the public hyperspectral images used in the experiments: http://www.ehu.eus/ccwintco/index.php/Hyperspectral_Remote_Sensing_Scenes
Indian Pines EADP experimental results
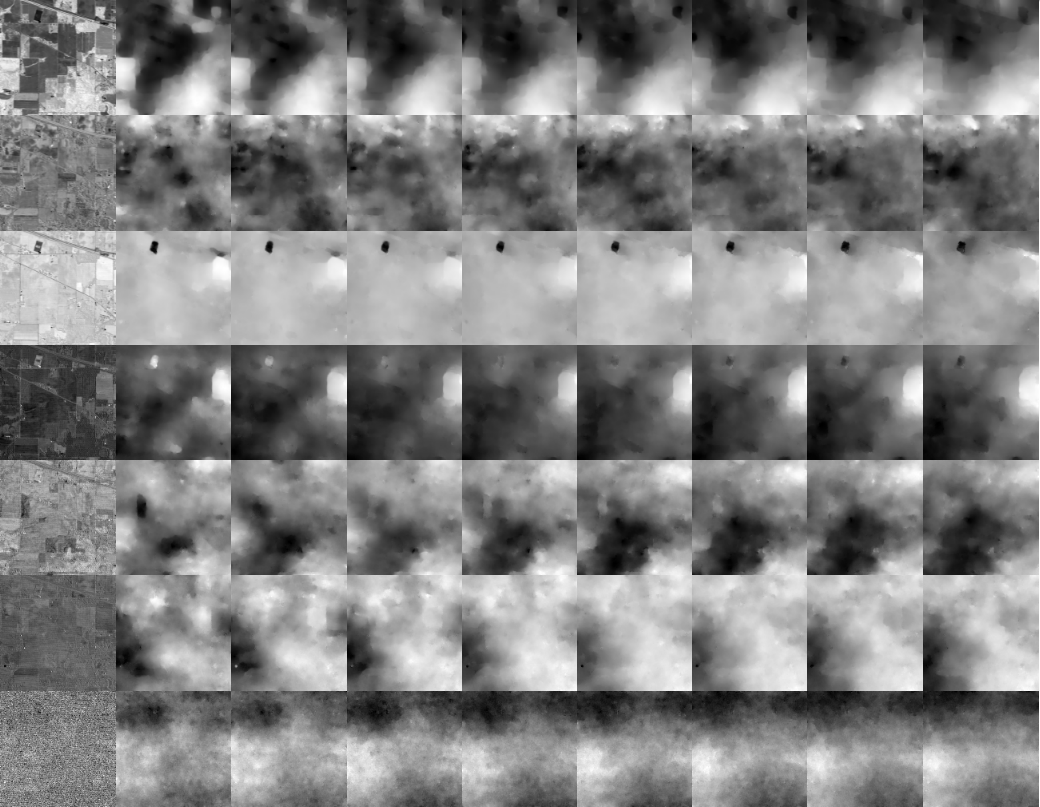
The following repository contains a subset of the data used for the experimental results detailed in the paper. The EADP generated with the proposed algorithm applied to the Indian Pines scene, as well as the samples and results for the classification experiments are available for downloading. EADP Dataset. The parameters used for the algorithm were N=7, C=8, sigma=1 and ts=65. The total ADP size is 9 and the total EADP size is 63.
The image below these lines corresponds to the EADP generated with the parameters detailed in the previous paragraph. Each row corresponds to one of the principal components extracted from the original hyperspectral image. The first column contains the principal component, and each subsequent column shows the filtered images produced by one iteration of the algorithm for a given process time. The process time is the same for all the images represented in the same column.
The average results for 100 classification experiments using the EADP are as follows:
| Metric | Value | Std |
|---|---|---|
| OA | 92.45% | 1.18 |
| AA | 95.27% | 0.72 |
| Kappa | 91.34% | 1.34 |
| # | Class | Accuracy |
|---|---|---|
| 1 | Alfalfa | 0.981 |
| 2 | Corn-notill | 0.928 |
| 3 | Corn-mintill | 0.959 |
| 4 | Corn | 0.987 |
| 5 | Grass/pasture | 0.967 |
| 6 | Grass-trees | 0.989 |
| 7 | Grass-pasture-mowed | 0.961 |
| 8 | Hay-windrowed | 1 |
| 9 | Oats | 1 |
| 10 | Soybean-notill | 0.753 |
| 11 | Soybean-mintill | 0.905 |
| 12 | Soybean-clean | 0.830 |
| 13 | Wheat | 0.994 |
| 14 | Woods | 0.998 |
| 15 | Bld-Grass-Trees | 0.991 |
| 16 | Stone-Steel | 0.999 |